What is Spectral Analysis?
Spectral analysis, or spectroscopy, the study of the interaction of electromagnetic radiation (EMR) with matter. The fundamental basis of spectroscopy is that atoms and molecules interact with different frequency components of the electromagnetic spectrum, and they absorb and emit specific quanta of energy during these interactions. Atoms or molecules move to higher energy level when they absorb EMR. Spectroscopy includes all methods of producing and analyzing light spectra. Spectroscopy is increasingly being used by soil scientists to quantify and identify organic matter and carbon in samples. The electromagnetic spectrum shows the range of all possible frequencies of electromagnetic radiation (light) (Figure 1).
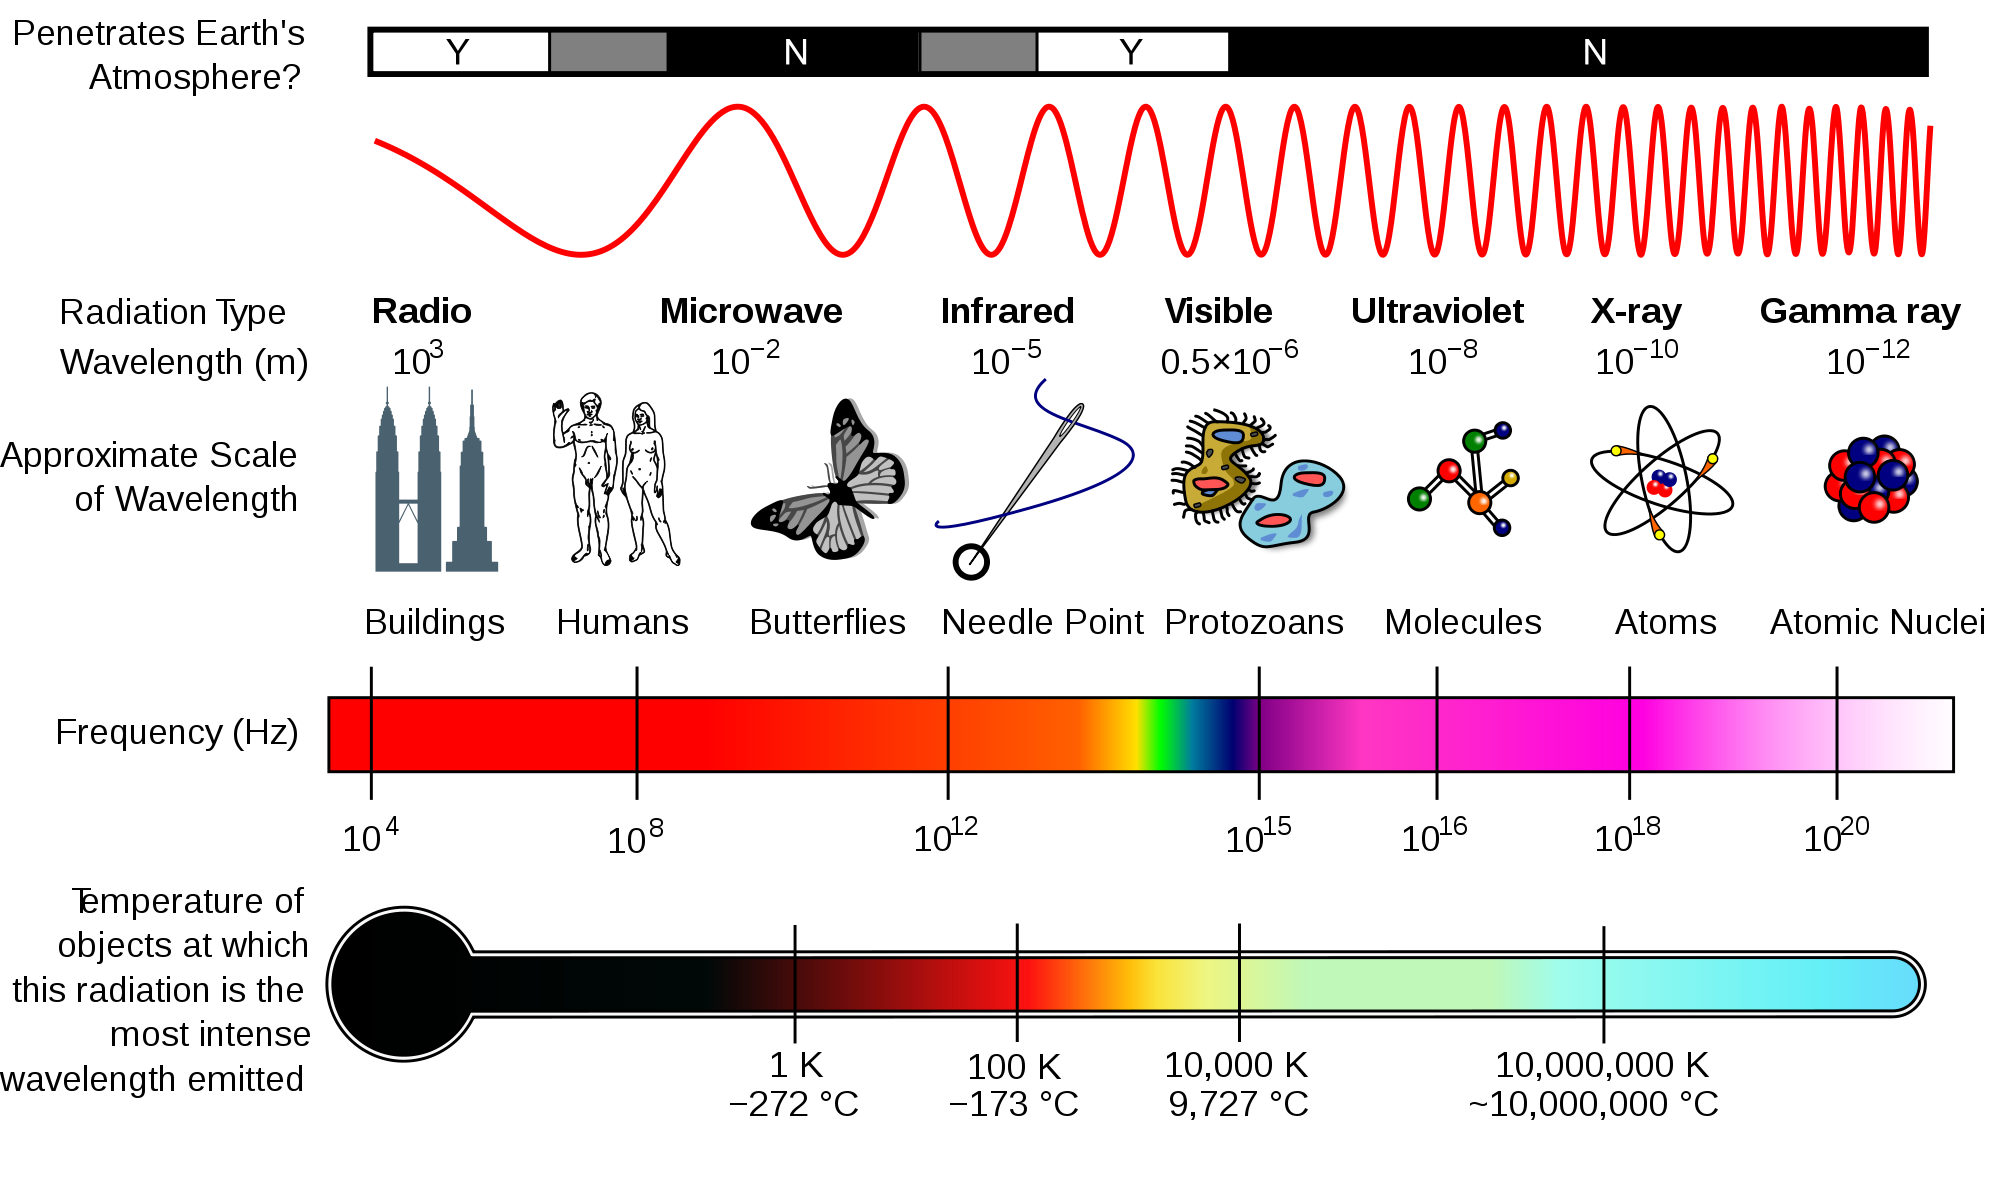 Figure 1. Electromagnetic spectrum from Wikipedia
In the context of soil science and biogeochemistry, spectral analysis is used to identify different types of organic compounds in a sample based on the reflectance (i.e. spectral signature) or absorption of a specific type or wavelength of electromagnetic radiation. SOM includes a variety of different forms of carbon that originate from heterogeneous sources (i.e. plants, animals, microbes, and transformations associated with decomposition). Thus, the advantage of spectral analyses is that these techniques can identify and broadly classify organic matter based on the compounds’ ability to absorb and/or emit electromagnetic radiation. However, these methods often require adequate statistical and/or numerical analyses techniques (i.e. Fourier Transformation to convert time-domain data to frequency-domain data or Partial Least Squares Regression to sort through many highly collinear spectral bands from relatively few observations). In addition, the results of spectral analyses may need to be coupled with other analytical approaches (i.e. biological, chemical, physical, or thermal fractionation - include links to these pages) to determine the implication of SOM composition for soil health and soil best management practices. Recent studies (see “Applications(link)” section) have utilized these techniques to their advantage to answer relevant questions about SOM dynamics and stability. Many techniques of spectral analysis exist, but this section will focus on a few that are commonly used in soil science.
Sources:
Brown et al. (2006) DOI: 10.1016/j.geoderma.2005.04.025
Denef et al. (2009) DOI: 10.1017/CBO9780511711794
Methods of Spectral Analyses
A. Infrared (IR) Spectroscopy
In infrared spectroscopy, infrared light interacts with a molecule causing the bonds to vibrate, stretch, bend, rock, etc., which characterizes the bonding environment. For example, a compound such as vanillin will absorb infrared light corresponding in energy to the vibrations that result from vibration of C-C, C-H or other bonds in the compound, thus resulting in a unique reflection of its molecular structure (Figure 2). Furthermore, Figure 3 shows the infrared range from 700nm to 1,000,000nm, with the exception of VNIR and FTIR, which looks at a portion of the visible spectrum. The IR spectrum is recorded by passing a beam of IR light through a sample, then when the frequency of the passing beam of light is equal to the vibrational frequency of a given bond, EMR is absorbed. Afterwards, measurement of the amount of transmitted light reveals how much energy was absorbed at each wavelength.
Sources:
Michigan State University
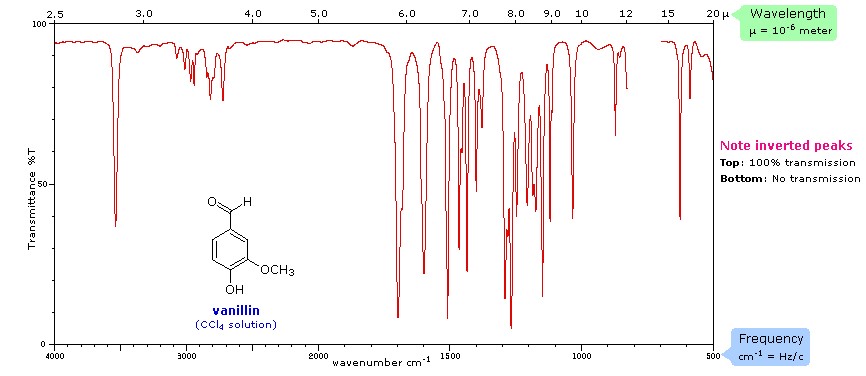
Figure 2. Spectral signature of vanillin (CCl~4~) from Michigan State University
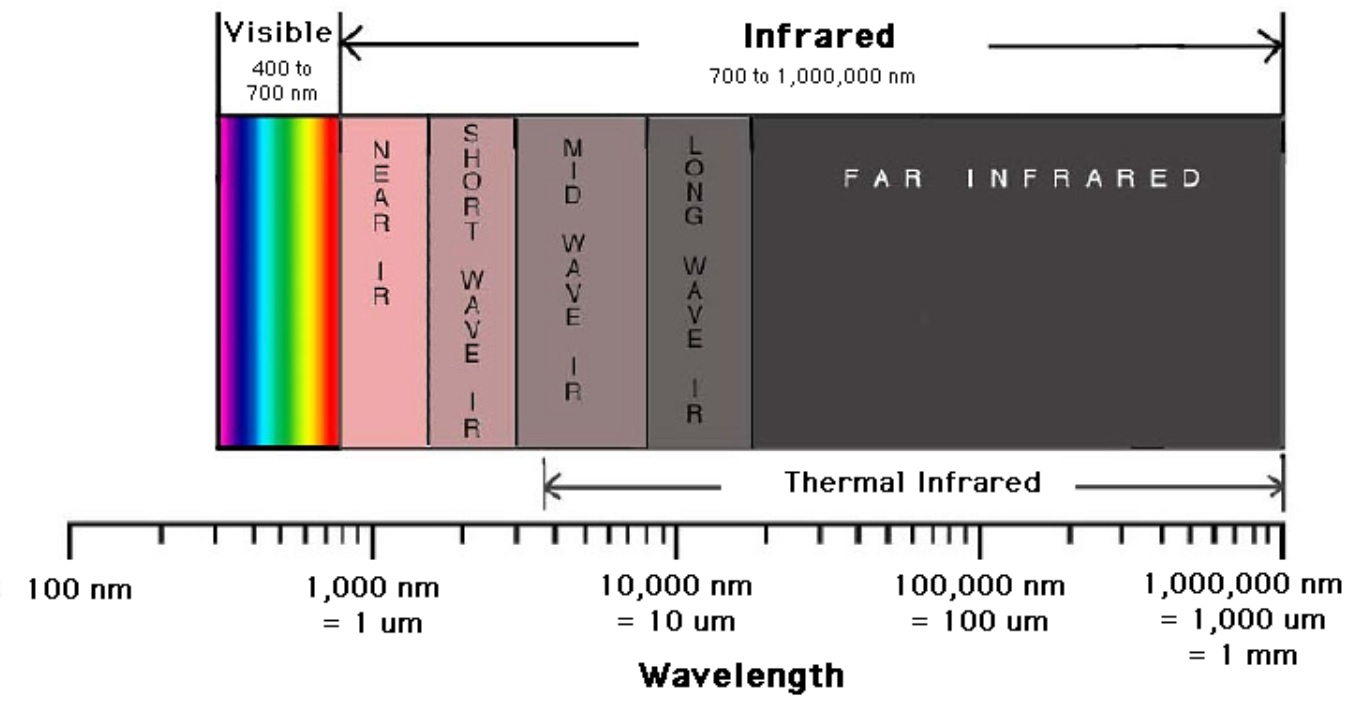
Figure 3. A breakdown of the infrared region of the electromagnetic spectrum from Digital Earth Watch
1. Visible Near-Infrared (VNIR) - 350-2500nm
VNIR reflectance is used to determine soil mineralogy, clay content, cation exchange capacity (CEC), and concentrations of SOC, soil inorganic carbon, and citrate-dithionite extractable Fe (Table 1). One of the most desirable qualities of the VNIR technique is that it is quick and relatively inexpensive, compared to the other techniques.
Sources:
Brown et al. (2006) DOI: 10.1016/j.geoderma.2005.04.025
.png) Table 1. A list of key soil constituents, their VNIR absorptions, and the associated soil taxonomy diagnostics from Brown et al.(2006) 10.1016/j.geoderma.2005.04.025
Table 1. A list of key soil constituents, their VNIR absorptions, and the associated soil taxonomy diagnostics from Brown et al.(2006) 10.1016/j.geoderma.2005.04.025
2. Fourier-Transform Infrared (FTIR) 400-4,000nm
This method, most commonly used in soil science research, to derive information about molecular bonds of inorganic and organic compounds. In FTIR analyses, one uses optical benches that use an arrangement of mirrors (Michelson Interferometer) to produce interference signals of the sample source light. The source light is split into two beams and reflected back by each mirror (moveable and static). The movable mirror causes phase-lags and an interference pattern composed of all frequency signals of the sample in a time-domain. Instead of one, in FTIR, a beam containing many different wavelengths of light is let through at once, and the total beam intensity measured. After repeating the process many times (for many mirror positions), the well resolved time domain data is converted mathematically (Fourier-transformed) to frequency domain, which then generates a spectrum based on the functional groups present in the sample analyzed. Soil organic matter or minerals produce a “fingerprint” in the IR spectrum, then the chemical family or identity can be determined using a reference database.
Sources:
EAG Laboratory (https://www.eag.com/)
Denef et al. (2009) DOI: 10.1017/CBO9780511711794
Parkih at al. (2014) DOI: 10.1016/B978-0-12-800132-5.00001-8
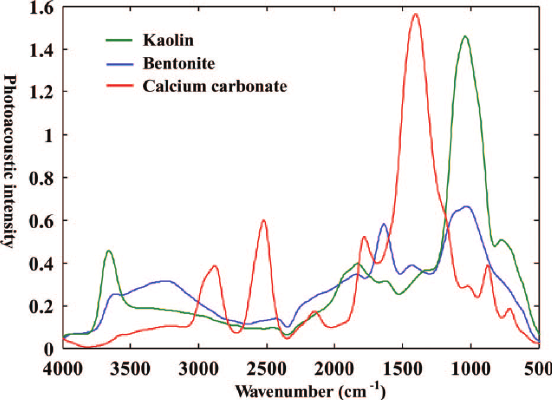 Figure 4. FTIR spectra of kaolin, bentonite, and calcium carbonate from Du and Zhou (2011) 10.1080/05704928.2011.570837
B. Nuclear Magnetic Resonance (NMR) Spectroscopy
NMR relies on the nature of some nuclei that possess spin (ex. ^13^C, as opposed to ^12^C where the spins in its subatomic particles are paired against each other, such that the nucleus of the atom has no overall spin). When a given nucleus is in a magnetic field, lower energy level have more nuclei than the higher level. But, the nuclei can be excited into a higher energy level by application of electromagnetic radiation. Nuclei that possess spin (ex. ex. ^1^H, ^13^C) precess about their axis parallel with an externally applied magnetic field. Hence, when a second magnetic field is applied at a right angle, the nuclei resonate, thereby inducing a measurable voltage change, and then they can be excited into a higher energy level using radio wave. Once the molecule absorbs the external energy, the nuclei resonate at a different frequency that depends on the chemical environment that the nuclei resides in (i.e. nature of bonds, constituent organic functional groups, etc). By varying strength of the magnetic field, we can then produce a spectrum of electromagnetic radiation. Figure 5 below shows the spectrum of camphor. Natural OM spectra can be reconstructed as a mixture of spectra of standard biomolecules (lipid, lignin, carbohydrate, protein, charcoal, carbonyl). In the resultant ^13^C NMR spectra, we can then determine chemical composition of soil organic matter, where compounds are identified based on proportion of total organic functional groups in a sample, such as alkyl, aromatic, and carboxylic groups (Figure 5). This method is non-destructive and avoids the potential for secondary reactions. However, for some soils, ^13^C NMR can be complicated as ^13^C only represents about 1% of whole C in soil sample (where total soil C concentration can be 2% of total sample mass), and depends on their nature the soils can have high concentration of paramagnetic metal ions (ex. Fe and Mn) can cause interference with the NMR signals.
Check out this video from Thermo Fisher.
Sources:
Reeves III et al. (2012) DOI: 10.1016/B978-0-12-386897-8.00020-6
Denef et al. (2009) DOI: 10.1017/CBO9780511711794
EAG Laboratory (https://www.eag.com/)
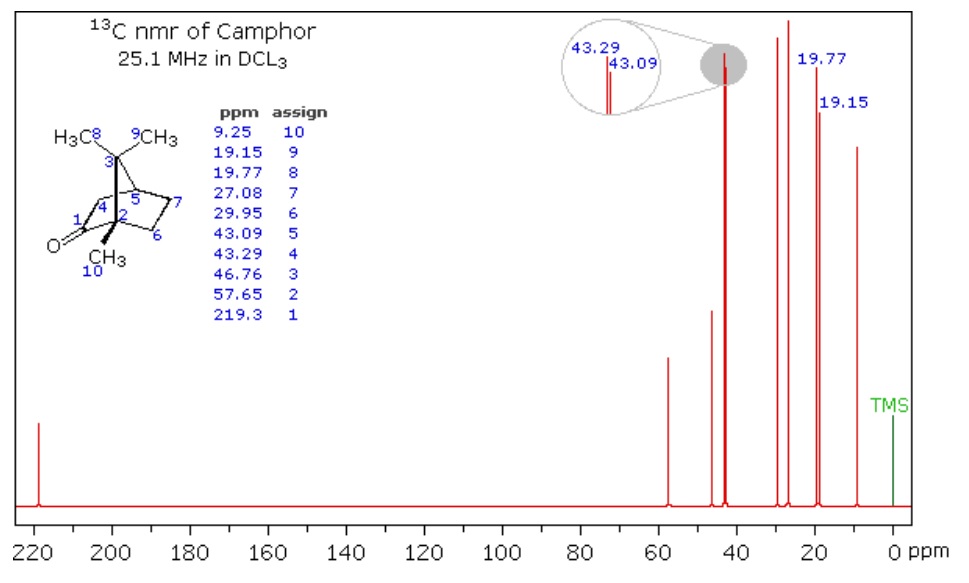
Figure 5. Spectrum of Camphor from Michigan State University
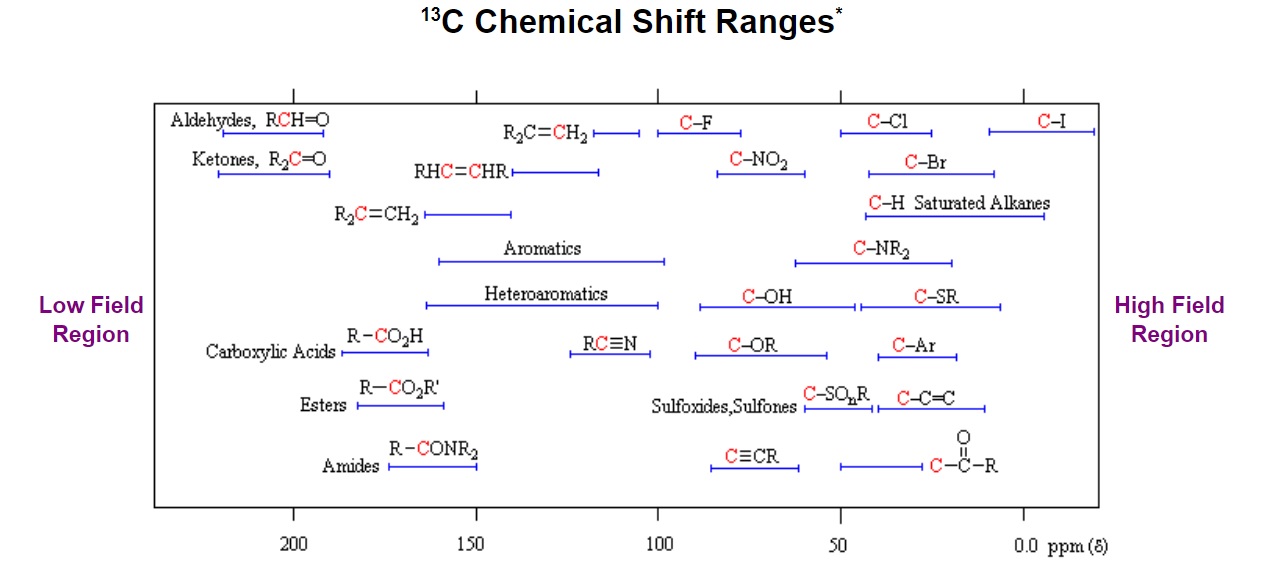
Figure 6. General distribution of carbon chemical shifts associated with different functional groups from Michigan State University
C. Raman Spectroscopy
This method, like IR spectroscopy, is used to determine and identify the chemical structure of compounds through vibrational spectroscopy and provides qualitative analysis of SOC/SOM. Additionally, this technique provides better resolution than FTIR and analyzes at a small scale (i.e. 1µm). Taquet et al. (2012) found that one of the advantages of Raman is that it is portable and robust, thus allowing quantitative analyses of absolute gas concentrations.
Sources:
Taquet et al. (2012) DOI: 10.1016/j.ijggc.2012.10.003
EAG Laboratory (https://www.eag.com/)
.jpg)
Figure 7. Diagram of Raman spectrometer and the resulting spectra of TAPP Porphyrin powder from University of Maryland
Figure 8. Compound characteristics as they are related to a spectral signature produced from a Raman spectrometer from nanophoton
D. X-ray
X-ray absorption spectroscopy (XAS) measures the dipole mediated transition of an electron in a deep core state into an unoccupied state, where atomic X-rays are emitted during electronic transitions. Because X-rays have characteristic energies related to the atomic number, and each element therefore has a characteristic X-ray spectrum. in XAS, increase in absorption is observed (giving rise to an absorption edge) when the energy of the incident photons causes excitation of a core electron of the absorbing atom. The energies of the absorbed radiation at these edges correspond to the binding energies of electrons in the K, L, M,, shells of the absorbing elements.
1. X-ray Absorption Near-Edge Structure (XANES) or Near edge X-ray Absorption Fine Structure (NEXAFS)
XANES spectroscopy is typically used to derive information about the valence and density of states of the absorber, as well as qualitative structural information. NEXAFS or EXAFS on the other hand are particularly useful to derive local atomic structure where different coordination geometries lead to distinct near-edge spectra. For example, XANES is used to identify carbon nanotubes (CNTs) using elemental mapping and analyze interface reactions. Interactions between CNT largely depend on the environment in which they are (i.e. saturated soil). In samples with a high C content, x-rays tend to be absorbed, easily pass through water, and do not deflect or scatter through air bubbles, thus, enabling samples to be tested for CNTs. Figure 9 shows the 3 phases of a XANES/NEXAFS spectra.
Sources:
Jokic et al.(2003) DOI: 10.1016/S0016-7037(03)00101-7
Sedlmair et al. (2012) DOI: 10.1016/j.chemgeo.2011.08.009
.jpg)
Figure 9. Example of a XANES/NEXAFS spectra from Wikipedia
2. X-Ray Fluorescence (XRF)
This non-destructive technique is used to quantify the elemental compositions of SOM and measure film thickness and composition. The soil sample is irradiated with X-rays that interact with the innermost electrons of the atom (K- and L-shells), causing the emission of X-rays with energies characteristic of the elements present (Figure 10). This method can analyze a few micrometers to several millimeters depending on the material.
Sources:
EAG Laboratory (https://www.eag.com/)
](/SOC-Hub/img/4ai/XRF_1.png)
Figure 10. XRF spectra of a sample containing various elements from Metallurgist
Applications
Pollutants in the soil
Jokic et al. (2003) analyzed prairie wetland soils in Saskatchewan, Canada using elemental analysis, NMR and XANES spectroscopy with an emphasis on organic carbon and sulphur structures. After comparison with adjacent upland and cultivated soils, they found that the wetland soils have a significant ability to sequester pollutants such as polycyclic aromatic hydrocarbon (PAHs). Thus, drying of the wetlands, caused by either drainage or climate change, may result in the rapid decomposition of the more labile organic matter, releasing carbon dioxide into the atmosphere. DOI: 10.1016/S0016-7037(03)00101-7
Soil carbon and climate change
Another study done by Gillespie et al. (2014) characterized and developed relationships between the chemistry and bioavailability of SOC in the horizons of Subarctic earth hummocks. Biodegradability was assessed in a laboratory controlled mineralization study, XANES was used to characterize the chemical composition of the SOM, and thermal stability was determined by Rock-Eval pyrolysis. Their results indicated that there may be a pool of labile SOC, relatively rich in phenolic compounds, in perennially frozen soils which may be susceptible to decomposition in a warming climate. DOI: 10.1016/j.soilbio.2013.09.021
Modelling soil carbon fractions
In Florida, Knox et al. (2015) sampled 1014 sites for individual pools of soil carbon to better understand processes such as decomposition and accretion of soil C. VNIR, MIR, and a combination of the VNIR-MIR spectral region were used to estimate four different soil C fractions - total carbon, soil organic carbon, recalcitrant carbon, and hydrolysable carbon. Partial least squares regression (PLSR) and random forest (RF) was successful in modelling the four fractions, although, the latter is recommended for future studies planning to conduct chemometric analysis of C fractions. DOI: 10.1016/j.geoderma.2014.10.019