What is the role of biomes in the carbon cycle?
Higher concentrations of carbon in the atmosphere in the form of CO2 and CH4 lead to a stronger greenhouse effects and warmer temperatures, but does it really matter how much carbon is stored in biomes? Yes, if properly managed carbon stocks above and below ground have the potential of partially mitigating the carbon emissions from anthropogenic and natural sources. In fact, more carbon is stored in the world’s biomes than in the atmosphere (Figure 1). Vegetation not only affects the carbon cycle through the processes of photosynthesis and respiration, but also when vegetation dies or burns. Understanding plant distribution throughout the globe and its relationship with climate contributes to a better understanding of the potential-and challenges-of managing biomes and their natural carbon pools (or sinks).
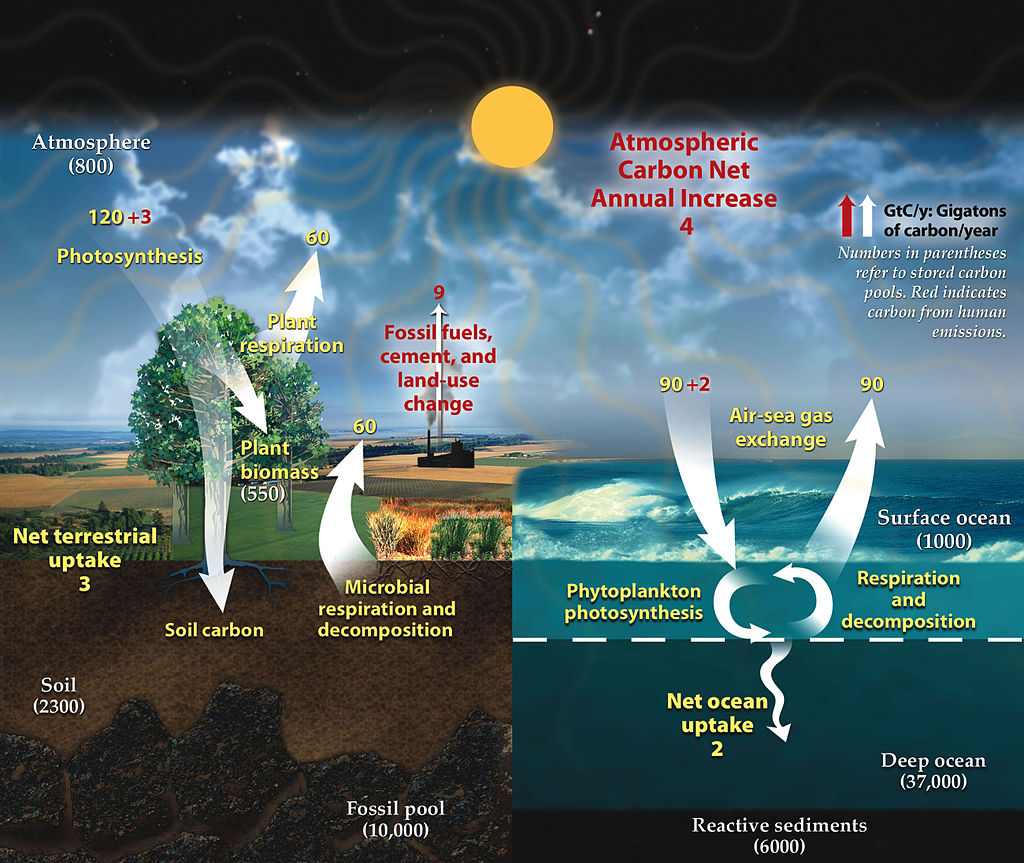 Figure 1 – This figure describes the carbon cycle, and the arrows indicate the flow of carbon. Arrows indicate the flow of carbon, with yellow numbers being natural fluxes and red numbers being human contributions in gigatons of carbon per year. Numbers in parentheses indicate carbon pools. Take a closer look at the number and check how much carbon is stored in the soil. Diagram adapted from U.S. DOE, Biological and Environmental Research Information System. From NASA Earth Observatory
Biomes are very large ecological areas defined by climate and other abiotic factors such as water availability and soils. Globally, the Earth is divided into 7 basic biome types that contain organic carbon pools above and below ground (Figure 2 & 3). All biomes affect the carbon cycle, with vegetation playing a key role in the process of carbon sequestration. An enourmous amount of carbon is stored belowground. Although we frequently hear about the impact of carbon emissions released by fossils fuels, cement production, and land use change, scientists are concerned with the impact of rising temperatures on carbon stocks in frozen soils (e.g. permafrost).
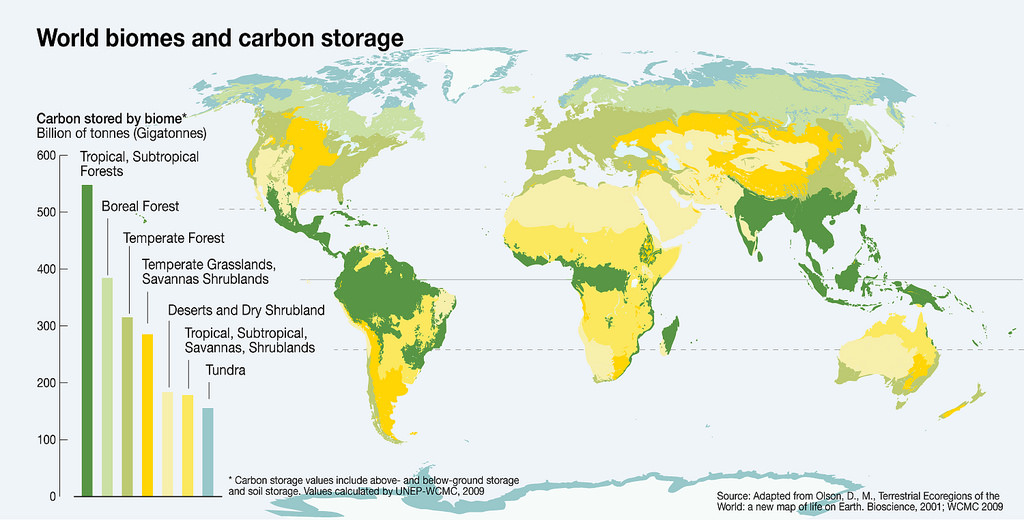 Figure 2 -– Each color in this graph represents a different biome. Many biomes occur in specific latitudes. For example, some biomes are prevalent in higher latitudes (e.g. tundra and boreal forest), while tropical and subtropical forests are mostly found between the Tropics of Cancer and of Capricorn. Where do we find temperate biomes? However, if we look at deserts and dry shrubland what do you see? Geographic distribution of biomes and their estimated carbon storage. From Grid Arendal
The increase of annual temperatures in the Arctic Circle has the potential of releasing an unprecedented amount of carbon into the atmosphere, leading to more carbon in the atmsophere and even warmer annual temperatures. These massive emissions may be offset by the adoption of management practices geared to increase the carbon sequestration in other biomes (e.g., grasslands and croplands). The knowledge of how vegetation and climate interact is essential to estimate future soil organic matter and soil carbon stocks. Additionally, it provides information to support decision makers and mitigate undesirable changes in atmospheric concentration of carbon and greenhouse gases (GHG).
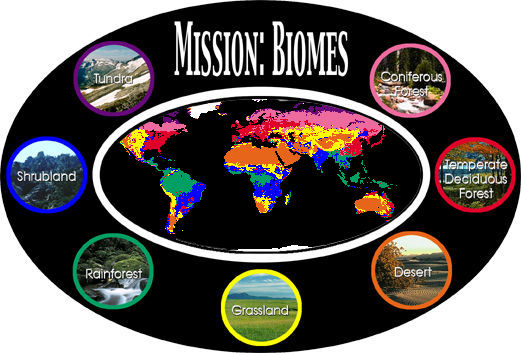 Figure 3 - Explore this NASA image to click through the different biome types.
Key references:
Lenton, T. M., Held, H., Kriegler, E., Hall, J. W., Lucht, W., Rahmstorf, S., & Schellnhuber, H. J. (2008). Tipping elements in the Earth’s climate system. Proceedings of the National Academy of Sciences, 105(6), 1786–1793. DOI: 10.1073/pnas.0705414105
Jobbágy, E. G., & Jackson, R. B. (2000). The vertical distribution of soil organic carbon and its relation to climate and vegetation. Ecological Applications, 10(2), 423–436. DOI: 10.1890/1051-0761
Schimel, D., Pavlick, R., Fisher, J. B., Asner, G. P., Saatchi, S., Townsend, P., Miller, C., Frankenberg, C., Cox, P. (2015). Observing terrestrial ecosystems and the carbon cycle from space. Global Change Biology, 21(5), 1762–1776. DOI: 10.1111/gcb.12822
Websites:
How does Climate influence Plant Distribution?
Climate plays a critical role in controlling ecosystem processes and structure. Annual temperature and water availability limit the expansion of vegetation when it exceeds a species lethal threshold for survival (Figure 4). Deserts are found at different latitudes (Figure 2), but the lack of water prevents the survival of most types of vegetation. Although grasslands are present in a wide range of latitudes and altitudes, different types of grasses respond differently to temperature and precipitation (Figures 5a and 5b). Some types of grasses prefer warmer and wetter climates characteristic, whereas other types prevail in areas with minimum temperatures below 15°C.
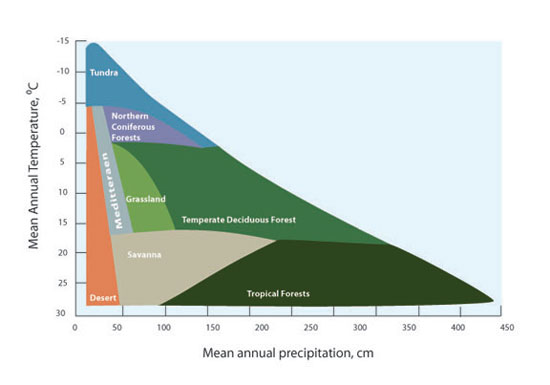 Figure 4 - The distribution of biomes is affected by annual temperature and precipitation. Tundra occurs in locations with lower temperature and lower precipitation compared to tropical forests. For full figure text see Forseth (2010)
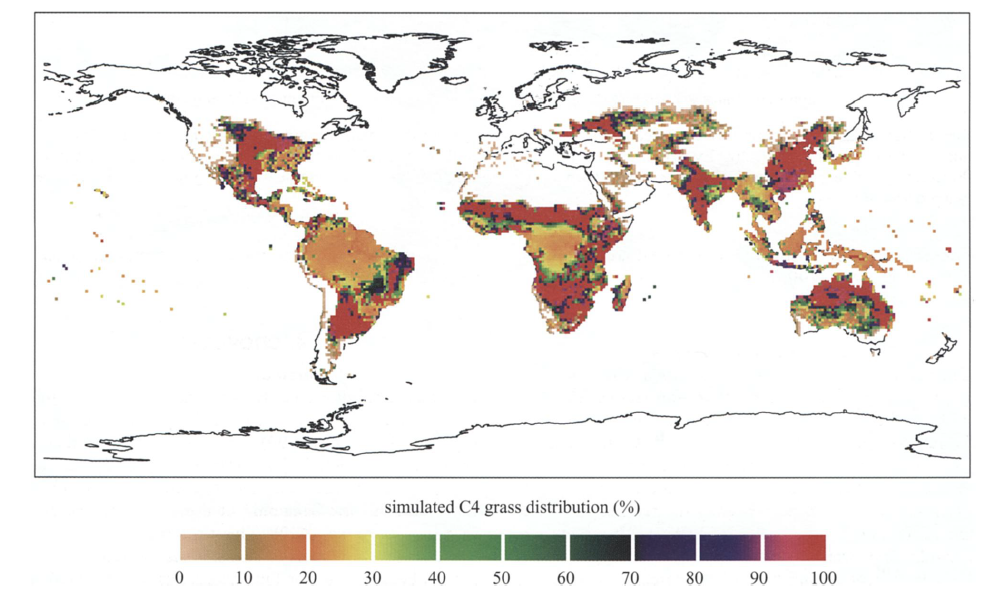 a) Simulation of global scale distribution of C4 grassland. For full figure see Woodward, Lomans and Kelly (2004)
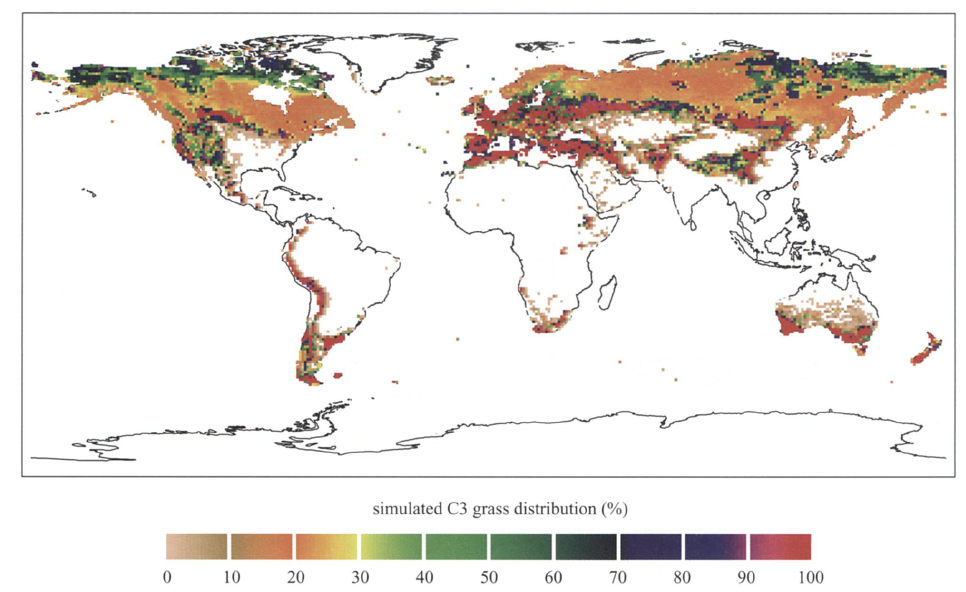 b) Simulation of global scale distribution of C3 grassland. For full figure see Woodward, Lomans and Kelly (2004)
Figures 5a and 5b – When we compare the simulations of the global scale distribution of two different types of grasses (C3 and C4), we observe that they are found in different latitudes or elevation. For example, C4 grassland is found mainly in the tropics, while C3 grasses thrives in areas of high elevation or higher latitude. The color bar under each graph contains values that represent percentage of land cover. Simulations were based on data from 1990 to 2000.
Similar behavior also applies to other types of biomes. Trees cover approximately one-third of the Earth’s land area, with forests storing up to 45% of the carbon on land. However, trees can only thrive in certain ranges of temperature and precipitation thresholds specific for each species. To illustrate, let’s consider the tropical forest biome bounded by the Tropics of Cancer and of Capricorn. With the average annual temperature ranging from 20°C to 25°C and the annual precipitation exceeding 2000 mm, tropical forests are characterized by highly diverse flora and the predominance of evergreen broadleaf trees and larger leafs and higher leaf mass (Figure 2).
References:
Chapin, F., Matson, P. A., & Vitousek, P. M. (2012). Principles of terrestrial ecosystem ecology. Principles of Terrestrial Ecosystem Ecology. DOI: 10.1007/978-1-4419-9504-9
Woodward, F. I., & Williams, B. G. (1987). Climate and Plant Distribution at Global and Local Scales. Vegetatio, 69(1), 189–197.DOI: 10.1007/BF00038700
Woodward, F. I., Lomas, M. R., & Kelly, C. K. (2004). Global Climate and the Distribution of Plant Biomes. Philosophical Transactions: Biological Sciences, 359(1450), 1465–1476. DOI: 10.1098/rstb.2004.1525
Websites:
Earth Observatory - Nasa
University of California Museum of Paleontology (UC-Berkeley)
How does climate change influence plant distribution?
With increasing global temperatures, we are witnessing reduced snow cover, receding glaciers, warmer oceans, and more frequent droughsts amongst other things. The impacts go beyond the natural climate fluctuations, affecting plant phenology and plant distribution, and changing land cover in different parts of our planet. In some regions, flowering is happening earlier in the season, in others, species are migrating to higher altitudes and further north. Increases in the altitude of the upper limit of treelines have been documented in various locations such as the Swiss Alps, Southern California’s Santa Rosa Mountains, and the Italian Alps. Even with warmer temperatures, the migration of species is not ubiquitous because it is bounded by the plant’s dispersal abilities. Warmer temperatures and increased precipitation have facilitated the dispersion of alien species across the same latitude. For example, climate change has contributed to the dispersal of alien grasses such as the cogongrass (Imperata cylindrica) in the Gulf Coast of the United States and the water hyacinth (Eichhornia crassipes) in Lake Victoria, Eastern Africa (Figure 6).
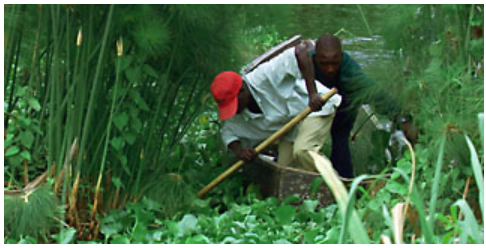 Figure 6 – For many years, water hyacinth, an invasive species, dominated the shoreline of Lake Victoria (Eastern Africa). For full figure text see PBS
The abundance of above and below ground soil organic matter and carbon in vegetation depends directly on the climate or biome type. Climatic changes including fluctuating temperatures, changes in precipitation, and altering of atmospheric processes all affect carbon. Climate plays a significant role in not only determining location of these plants, but overall survivorship of ecosystems dependent on them.
Isolating the effects of climate change and land use is a challenging task. Since the 1990s, various research groups have developed computer models known as Dynamic Global Vegetation Models (DGVM) to simulate the effects of climate change in land cover and in the carbon and water cycles. Here are some examples - the LPJ model (Germany/Sweden), the IBIS Integrated Biosphere Simulator (U.S.), the MC1 model (U.S.), the BIOMAP model (U.S.), and the SDGVM (U.K.). More advanced earth system models also incorporate feedbacks from shifts in the biosphere to the atmosphere, estimating the impact of changes in terrestrial carbon pools on climate. Feedbacks, both positive and negative, are an important component of models measuring the carbon cycle primarily to infer the future impacts of climate change. To learn more about models that estimate terrestrial carbon emissions and carbon pools, click here.
Although there are different models available and under development to estimate the influence of climate change in different biomes. Figure 7 illustrates DVGM projections of vegetation dispersion from a changing climate. Due to the complexity of estimating such effects, some studies have provided contradictory results. One of the impacts of modifications in land cover is changes on the albedo effect, resulting in warmer temperatures. For example, changes in land cover affect how much of the Sun’s energy is reflected (or not) by the Earth’s surface (known also as the albedo effect). For example, areas covered with snow (lighter surfaces) are better at reflecting the solar radiation, than darker surfaces. The latter increases the absorption of solar radiation by the Earth’s surface (Figure 8).
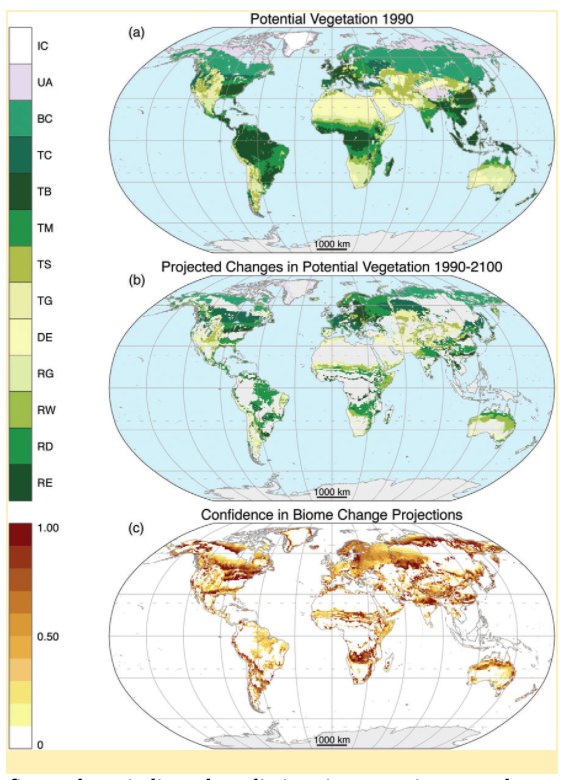 Figure 7 - The figure above indicates predictions in vegetation spread across the globe, starting with historical data from 1990, and projecting until the year 2100, using the MC1 DVGM Model. Biomes in the legend: ice (IC), tundra and alpine (UA), boreal conifer forest (BC), temperate conifer forest (TC), temperate broadleaf forest (TB), temperate mixed forest (TM), temperate shrubland (TS), temperate grassland (TG), desert (DE), tropical grassland (RG), tropical woodland (RW), tropical deciduous broadleaf forest (RD), tropical evergreen broadleaf forest (RE). From Gonzalez et al. (2010)
 Figure 8 - Albedo effect describes the ability of surfaces of absorbing or reflecting solar radiation. While light-coloured (e.g. snow covered) surfaces are great at reflecting the sunlight (high albedo), dark-coloured surfaces contribute to the absorption of heat (low albedo). From Norwegian Polar Institute
References:
Bertin, R. I. (2008). Plant Phenology And Distribution In Relation To Recent Climate Change Plant phenology and distribution in relation to recent climate change. The Journal of the Torrey Botanical Society, 135(1), 126–146. DOI: 10.3159/07-RP-035R.1
Bradley, B. A., Wilcove, D. S., & Oppenheimer, M. (2010). Climate change increases risk of plant invasion in the Eastern United States. Biological Invasions, 12(6), 1855–1872. DOI: 10.1007/s10530-009-9597-y
Carlson, K. M., Curran, L. M., Asner, G. P., Pittman, A. M., Trigg, S. N., & Marion Adeney, J. (2012). Carbon emissions from forest conversion by Kalimantan oil palm plantations. Nature Climate Change, 3, 283. DOI: 10.1038/nclimate1702
Forseth, I. (2010) Terrestrial Biomes. Nature Education Knowledge 3(10):11
Gehrig-Fasel, Guisan, Zimmermann (2007) DOI: 10.1111/j.1654-1103.2007.tb02571.x
Gonzalez, P., Neilson, R.P., Lenihan, J.M., Drapek, R.J.Global Ecology and Biogeography vol. 19 issue 6 (2010) pp: 755-768 Published by Blackwell Publishing Ltd DOI: 10.1111/j.1466-8238.2010.00558.x
Kelly, A. E., & Goulden, M. L. (2008). Rapid shifts in plant distribution with recent climate change. Proceedings of the National Academy of Sciences, 105(33), 11823–11826. DOI: 10.1073/pnas.0802891105
Primack, R., Higuchi, H., & Miller-Rushing, A. (2009). The impact of climate change on cherry trees and other species in Japan. Biological Conservation (Vol. 142). DOI: 10.1016/j.biocon.2009.03.016
Websites:
Ecosystems with exceptional carbon storage abilities
Mangroves are excellent at carbon sequestration (Figure 9). They absorb aboveground carbon from the atmosphere, and transfer it into belowground carbon. Every year, the impacts of climate change and mangrove deforestation (Figure 10) in small island communities jeopardize the ability for that excess atmospheric carbon to be absorbed (Figure 11). Carbon is rapidly becoming a hot topic that can be used in future to offset emissions, particularly along shorelines. The carbon stored in coastal habitats is also known as “Coastal blue carbon”.
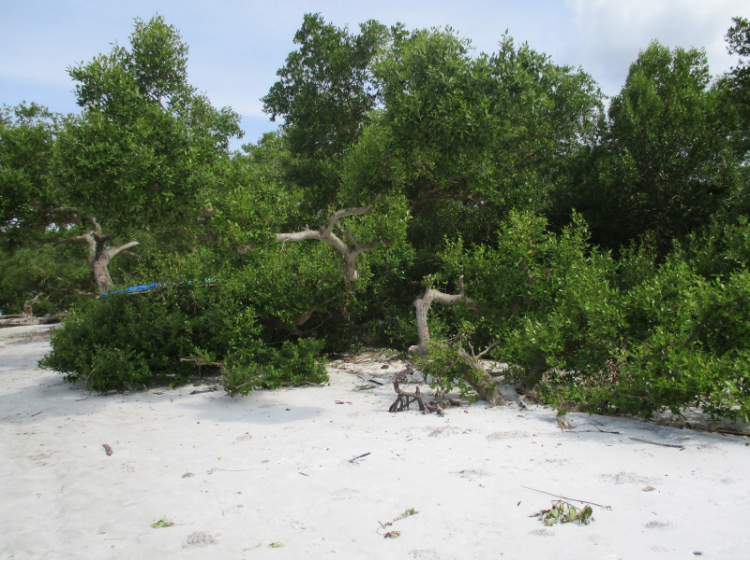 Figure 9. The picture above represents red mangroves found along the coast of Tumbe, Pemba Island. (Credit Genelle Watkins)
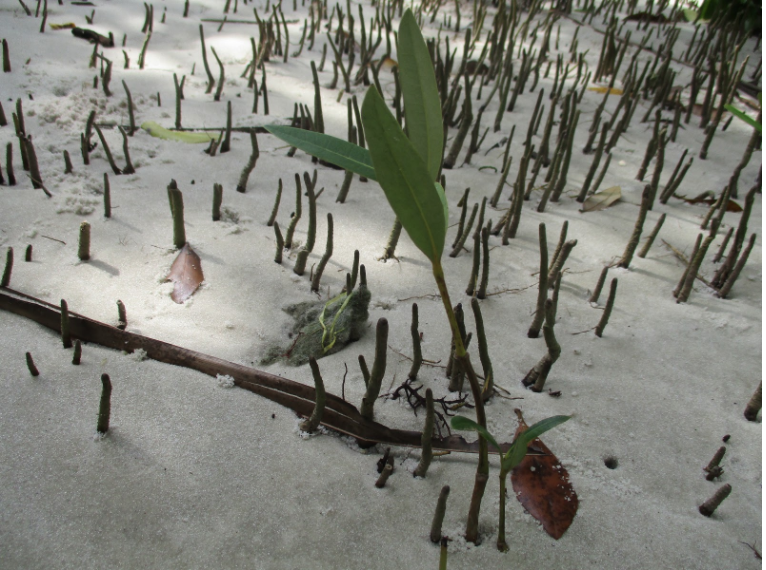 Figure 10. This figure depicts the coastal deforestation occurring in Pemba Island, East Africa. The small seedlings emerging from the beach sand is mkoko (red mangrove–Rhizophora mucronata) (Credit Genelle Watkins)
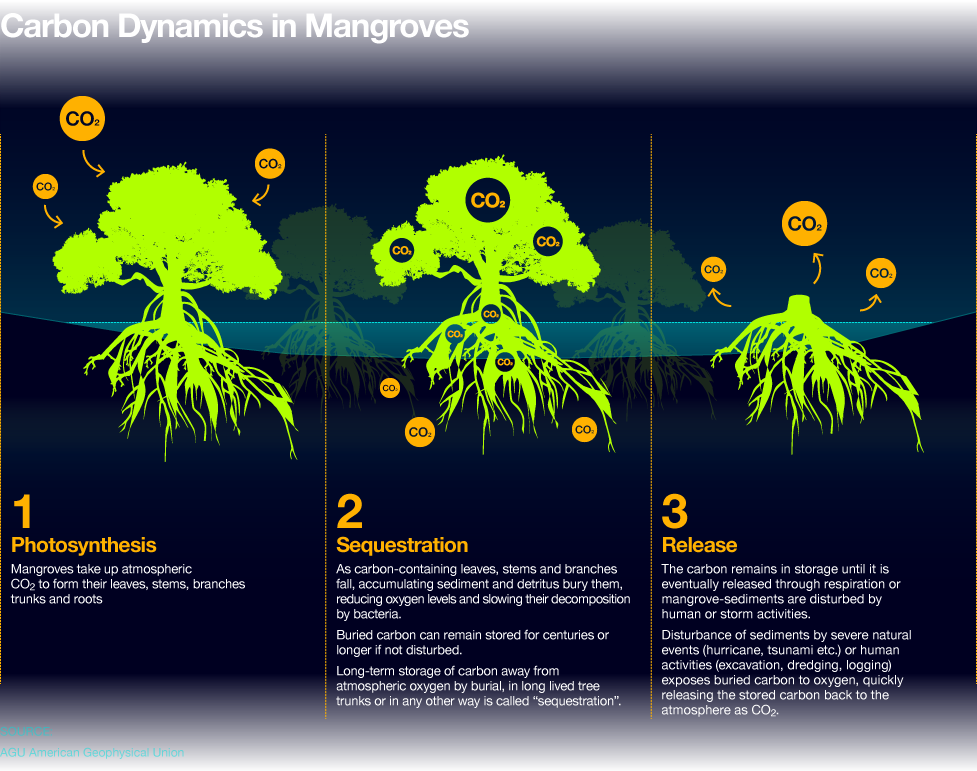
Figure 11 - The potential of carbon sequestration by mangroves is exceptional as described in the first two parts of this figure. However, the carbon stored by mangroves are released into the atmosphere when deforestation occurs (as illustrated in the last part). From Ocean Health Index
References:
Alongi, Daniel M. “Carbon Sequestration in Mangrove Forests.” Carbon Management, vol. 3, no. 3, 2012, pp. 313–322. DOI: 10.4155/cmt.12.20
Donato, Daniel C., et al. “Mangroves among the Most Carbon-Rich Forests in the Tropics.” Nature Geoscience, vol. 4, no. 5, 2011, pp. 293–297. DOI: 10.1038/ngeo1123
Spalding, M. (2013)Science: Mangrove Forests as Incredible Carbon Stores. Cool Green Science
Websites:
Metlink - Royal Meteorological Society
NOOA Fisheries
The Blue Carbon Initiative
Thawing permafrost increases carbon emissions into the atmosphere
Permafrost soils stay frozen all year round for at least two consecutive years (Figure 12), and occur in the Artic, Antartic, and some mountain regions. The carbon in permafrost has been stored and preserved for thousands of years but is now starting to be decomposed as temperatures increase and microbes wake up (Figure 13). Permafrost holds almost twice as much carbon as the atmosphere and large amounts of CO2 and CH4 will be released to the atmosphere if global temperatures continue to increase.
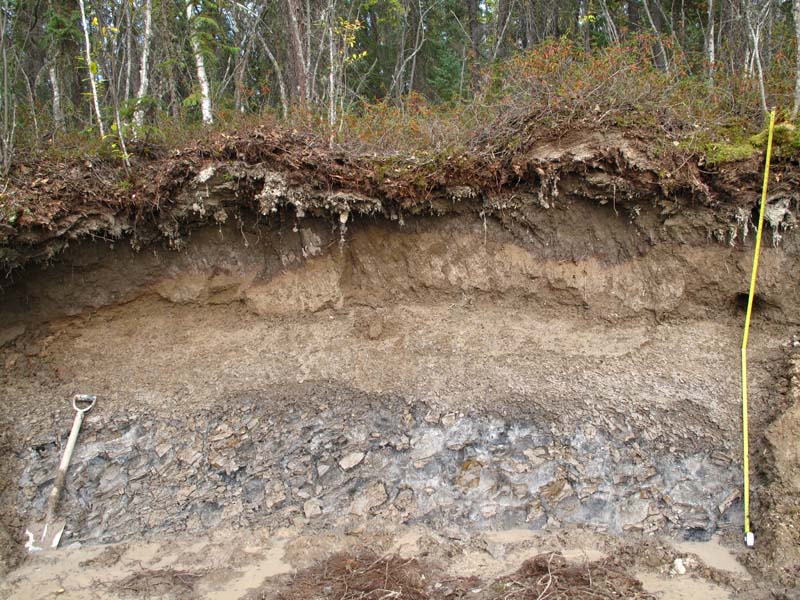 Figure 12 - Ice rich soil (permafrost) near Yellowknife NWT, Canada (Credit P. Morse Aug. 2014) From Natural Resources Canada
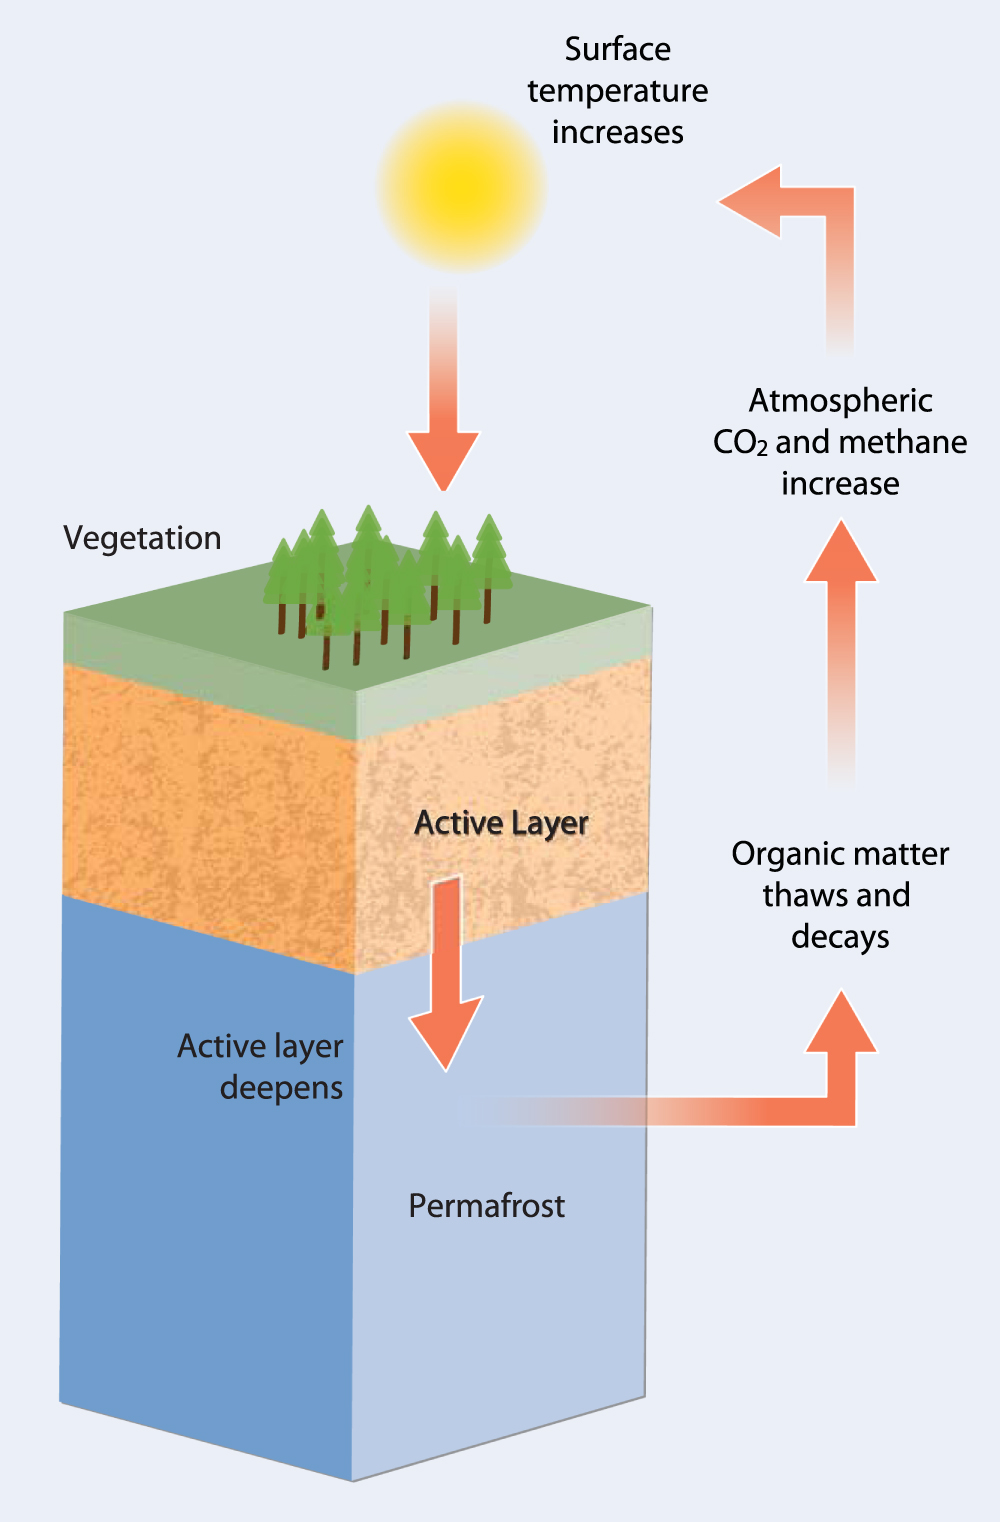 Figure 13 -This figure illustrates the permafrost carbon feedback (PCF). Higher temperatures cause the active layer to deepen thawing an increased amount of organic material. As the thickness of this layer increases, it leads to the decay of SOM at deeper levels and the release of CO2 and CH4 into the atmosphere causing the amplification of the effects of anthropogenic emissions on climate. Mechanisms of Arctic Greenhouse Gas Release. From Schaefer et al. (2014)
References:
Schuur, E.A.G., McGuire A.D., Schädel C., Grosse G., Harden J.W., Hayes D.J., Hugelius G., Koven C.D., Kuhry P., Lawrence D.M., Natali S.M., Olefeldt C., Romanovsky V.E., Schaefer K., Turetsky M.R., Treat C.C. and Vonk J.E. (2015). Climate change and the permafrost carbon feedback. Nature 520 (7546): 171-179. doi:10.1038/nature14338
Liljedahl, A. K., et al. (2016). Pan-Arctic ice-wedge degradation in warming permafrost and its influence on tundra hydrology. et al. (2016) DOI: 10.1038/NGEO2674
Schädel, C., McGuire, A.D., and Schuur, E.A.G. (2015). Permafrost Carbon Network 5-Year Systhesis Report. www.permafrostcarbon.org
Schaefer, K., Lantuit, H, Romanovsky, R.E., Schuur, E.A.G., Witt, R. (2014). The impact of the permafrost carbon feedback on global climate. Environ. Res. Lett. 9:085003. doi: 10.1088/1748-9326/9/8/085003
Tarnocai, C., Canadell, J.G., Schuur, E.A.G., Kuhry, P., Mazhitova, G., & Zimov, S. (2009). Soil organic carbon pools in the northern circumpolar permafrost region. Global Biogeochemical Cycles, 23(2). DOI: 10.1029/2008GB003327
Websites:
National Park Service
NOOA Artic Report Card 2017
Smithsonianmag.com
Global Implications
Vegetation and climate distribution go hand in hand. It is important to realize that climate is constantly changing and vegetation types that were seen in early decades, may not be reflective of what is found in current ecosystems. Biomes experiencing albedo effects, thawing permafrost layers, and high mangrove sequestration, are only some examples relating directly to climate and vegetation type. The world is full of carbon within many types of vegetation and resources are always changing. Recognize that what once was, may not be the same in the next few years!